Software Defined Radio Assignment - Exploring the RF Spectrum with RTL-SDR and Gqrx
Prepared by Dr. Aaron Scher
[email protected]
Oregon Institute of Technology
Back to Aaron's home page.
Equipment and software
For this assignment you will need a few pieces of equipment and some free software:
Assignment
For this assignment you are to
explore the RF spectrum. You will be creating a PowerPoint Presentation, saving it as a PDF,
and uploading it to Blackboard. You may also be asked to present in class (if so, please
see the Blackboard for more details). Here are the guidelines:
- The first slide is the title slide. At the very least, it should contain your name, the assignment
name, course number, and date.
- The second slide should be your setup. For example, what type of antenna are you using?
Where are you geographically? Are you on in a high-rise? Are you by a window? Feel free to include
pictures along with your description.
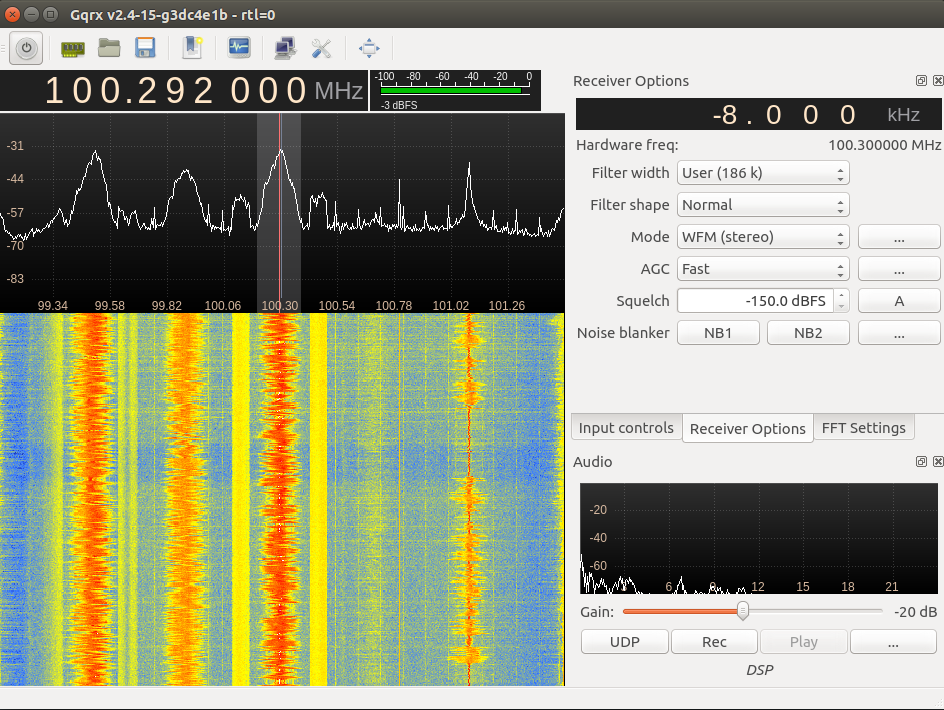
- Find at least five interesting signals and take screenshots
of these signals in Gqrx (be sure to include spectrum and water fall plot). Only one of your five signals can be commercial FM radio.
In your slide show, please answer the following questions
regarding each of the five signals:
- What is the frequency of the signal?
- Can you demodulate the RF signal and hear the audio signal? Describe what you hear.
For this, be sure to experiment with other modes besides WFM (especially the popular AM and Narrow FM modes.)
If you can decipher the audio signal, what mode allows you to hear the signal?
- What or who is generating the signal? Speculate if you do not know. Who is the signal
intended for?
- Is the signal analog or digital?
- Is the signal being broadcast continuously or in short intervals in time?
- Are there any other interesting observations regarding the signal?
- Note: Not all five of the signals need to be created by someone else... Feel free to generate a few
signals
using your own devices (garage door openers, cell phones, remote control toys, electromagnetic interference, etc.)
- The following resources may help you in your explorations:
- In your conclusion slide(s), please present any comments/philosophical insights regarding
your activities, along with any "tips and tricks" you have
developed for good signal hunting with the RTL-SDR + Gqrx.