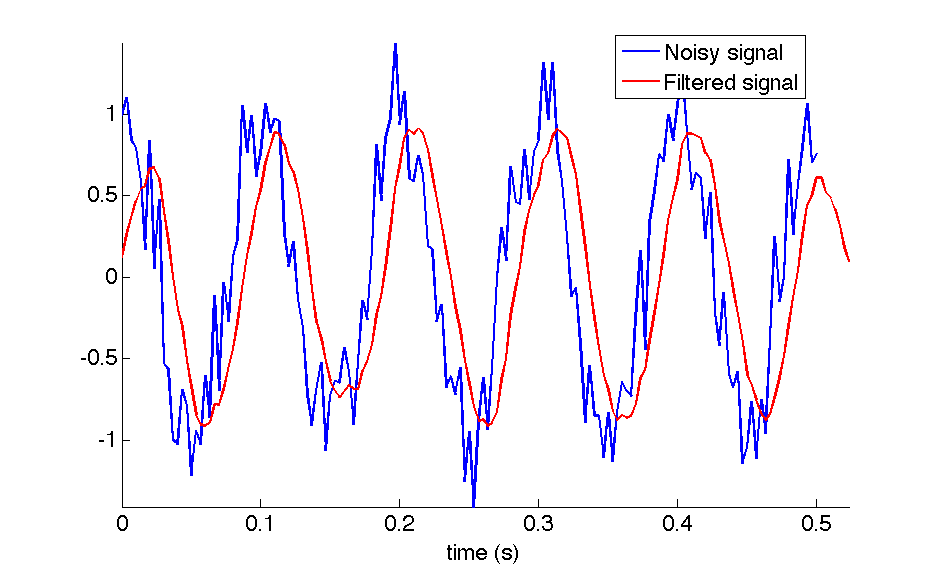
MATLAB script for creating Figure 1 in DSP Lab 3
clc;
clear all;
f0=10; %frequency of sinusoid
fs=300; %sampling frequency
T0=1/f0; %period of sinusoid
Ts=1/fs; %sampling period
t=[0:Ts:5*T0]; %time vector... evaluate sinusoid from 0 to five periods
x=cos(2*pi*f0*t); %Create clean sinusoid signal
%Create noisy signal:
a=0.25; %0.25 standard deviation of the Gaussian noise
ns=a*randn(1,length(x)); %Gaussian noise
xn=x+ns; %Signal in noise
%Generate impulse response:
h=1/8*ones(1,8);
%Filter noisy signal using convolution:
xf=conv(xn,h); %Filtered output
%Filtered output is not the same size as the noisy input... Therefore, we
%need to create a new time vector for filtered output:
tf=[0:Ts:(length(xf)-1)*Ts];
%plot results:
plot(t,xn,'b',tf,xf,'r','LineWidth',1.2)
axis tight;
box off;
set(gcf,'color','w'); %set background color from grey (default) to white
legend('Noisy signal','Filtered signal')
xlabel('time (s)','fontsize',18);
set(gca,'FontSize',18) %set font size of axis tick labels to 18